Home » Prompt Engineering » How to create shareable infographics with ChatGPT and Canva: 5 powerful AI prompts

How to create shareable infographics with ChatGPT and Canva using 5 AI prompts

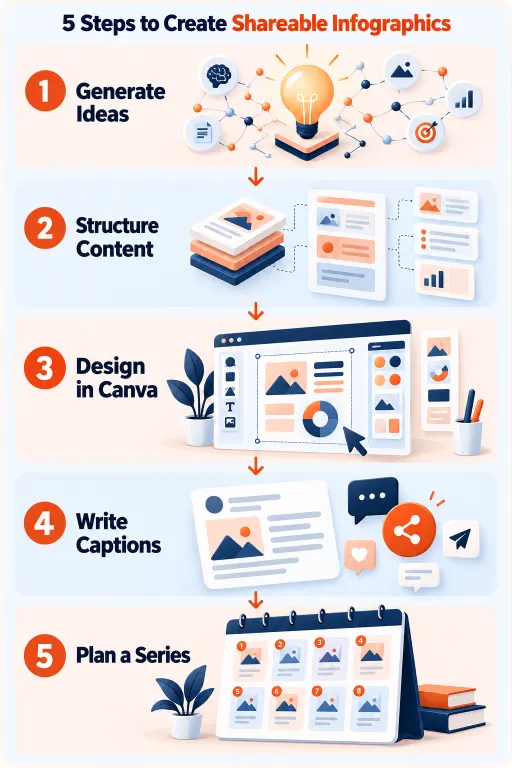
Vector illustration showing AI-assisted infographic creation with a content planning interface, design canvas, charts, visual elements, and social sharing icons

The content format with the highest share rate on social media — and how AI makes it accessible to any marketer

Infographics are the most consistently shared content format across LinkedIn, Instagram, Pinterest, and WhatsApp. They compress complex information into a visual understood in seconds, saved for later reference, and forwarded to colleagues without losing context.

The barrier has always been production. Creating a genuinely useful infographic traditionally required a researcher, a designer, and multiple rounds of revision before anything was shareworthy. Most content marketers and small business owners either skipped infographics or produced low-quality versions that did not travel.

AI has removed the hardest barrier: ideation and content structure. A well-prompted ChatGPT session produces a fully structured infographic — the concept, the data hierarchy, the section labels, the callout facts, the visual flow — in minutes. Canva provides the design infrastructure to execute that structure without a designer.

The combination produces infographics that are shareable because the underlying content structure is sound, the insight density is high, and the format respects the psychology of how people share — not just because the colours are on-brand.

This blog walks through the complete workflow: AI prompts for concept, structure, visual brief, distribution copy, and series planning.

Learn2Earn Labs AI Integrated Digital Marketing Training banner featuring AI-powered marketing skills, SEO, Google Ads, social media marketing, analytics, automation, practical projects, internship experience, and career-focused learning.

AI Integrated Digital Marketing Training

Build practical skills in SEO, Google Ads, Social Media Marketing, Analytics, Content Marketing, and AI-powered workflows through projects, live classes, internship exposure, and industry-focused learning.

Why most infographics do not get shared

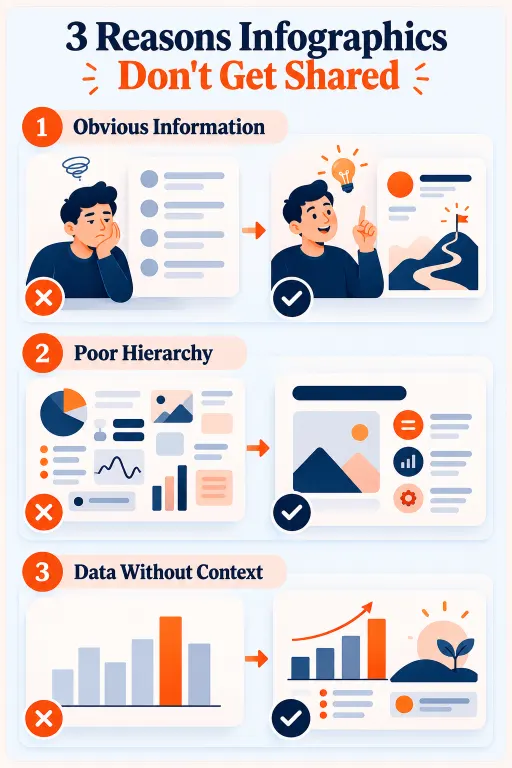
An infographic that does not get shared fails for one of three reasons.

The first is obvious information density. Information every reader already knows presented visually is wallpaper — they glance, register nothing new, and scroll on. A shareable infographic must contain at least one piece of information the reader did not know, or present known information in a way that reframes their understanding.

The second is visual hierarchy without information hierarchy. Many Canva infographics look good but are arranged decoratively rather than informationally. There is no clear sequence of insight — the eye moves across the infographic without building understanding in any direction. Shareable infographics lead the viewer through a logical progression that builds to a conclusion or revelation.

The third is data without context. “47% of marketers use AI tools” is inert. “47% of marketers use AI tools, compared to 12% three years ago — the fastest adoption rate of any marketing technology in history” is shareable, because it is surprising, specific, and implies something the reader wants to tell someone else.

Every prompt in this blog includes instructions that force insight density, information hierarchy, and contextualised data.

Prompt 1: generate the infographic concept

The starting point is not the design. It is the concept — the specific angle that makes this infographic worth sharing rather than merely worth making:

Role/brand: [e.g. “digital marketing trainer in India”]

Audience: [e.g. “marketing students and freshers entering the job market”]

Topic area: [broad topic]

Generate 8 specific infographic concept ideas.

For each:

  • Specific angle (not “social media marketing tips” but “the 6 Instagram content types ranked by average engagement rate in 2024”)
  • Primary insight or revelation the infographic communicates
  • Data type that supports it (statistics, comparisons, timelines, rankings, myths vs facts)
  • Why someone in this audience would share it (what does sharing say about them to their network?)
  • Best infographic format: statistical comparison / process / timeline / versus chart / myth-busting / anatomy breakdown / ranked list Identify the 2 concepts with highest share potential and explain why.

The “why would someone share this” instruction is the most important element. People share infographics for specific social reasons — to appear knowledgeable, to be helpful, to demonstrate professional awareness. Understanding the share motivation before designing changes what information is included and how it is framed. An infographic designed to make the sharer look informed is structurally different from one designed to be merely accurate.

Prompt 2: structure the infographic content

With a concept selected, structure the full content before opening Canva:

Concept: [from prompt 1]

Audience: [description]

Platform: [Instagram / LinkedIn / Pinterest / WhatsApp]

Structure the complete infographic content:

  1. Title (8 words max): specific, surprising, or intriguing — not generic
  2. Subtitle (optional, 10-15 words): adds context or quantifies the title claim
  3. Main sections (3-6 max):

   For each: section header (3-5 words) | core insight (one specific sentence) | supporting detail (context or comparison) | visual element suggestion

  1. Hero stat: the single most surprising piece of information — visually dominant
  2. Source line: 2-3 credible source types for this topic
  3. Takeaway line: one sentence telling the viewer what to do with this

Every word must earn its place — infographics are read at a glance.

Structuring content before opening Canva is the most critical workflow advice in this blog. Most marketers open Canva first, pick a template, and force content to fit its structure. This produces infographics where sections are added or removed because the template has placeholder boxes, not because the content requires them. Structure the content first and the design serves the information, not the other way around.


Educational infographic explaining three common infographic mistakes: obvious information, poor information hierarchy, and data without context, with visual examples of better content presentation
AI Integrated Full Stack Development training with React Node.js MongoDB and AI tools at Learn2Earn Labs

AI Integrated Full Stack Development Training

Master HTML, CSS, JavaScript, React, Node.js, Express.js, MongoDB, REST APIs, and AI-powered development workflows through live coding, practical projects, internship opportunities, and career-focused training.

Prompt 3: generate the visual brief for Canva

With content structured, generate a specific visual brief that guides Canva design decisions rather than leaving them to default template selections:

Infographic content: [paste structured content from prompt 2]

Platform: [where it will be shared]

Brand colours: [hex codes or description]

Audience: [description]

Generate a visual design brief:

  1. Format: portrait or landscape? | Ideal dimensions | Number of sections
  2. Colour palette: background, accent for hero stat, text colours
  3. Typography: heading style, body style, size hierarchy
  4. Icon/illustration direction: flat / outlined / illustrated / photo + specific icon categories for this topic
  5. Visual hierarchy:
    •    Where does the eye enter?
    •    Flow path from entry → hero stat → CTA
    •    What visually dominates?
  1. Canva search terms:
    •    3-4 terms to find relevant templates
    •    2-3 terms to find relevant icons/elements

Canva search terms at the end are the most immediately practical element. Without them, a marketer spends fifteen minutes searching generic terms and finding irrelevant templates. Specific search terms matched to infographic type and topic save that time and produce better results.

Prompt 4: generate captions and distribution copy

An infographic without strategic distribution copy is a design exercise. Platform-specific framing determines whether the infographic gets shared or scrolled past:

Infographic topic and key insight: [describe]

Target platforms: [list]

Audience: [description]

Generate distribution copy:

LinkedIn (150-200 words):

  • Opening hook: provocative question or counterintuitive statement
  • 3 bullet-point key insights (visible before “see more”)
  • One paragraph adding an insight not in the infographic
  • CTA for saves, comments, or follows (not generic “what do you think?”)

Instagram (80-120 words):

  • Lead with the most surprising statistic
  • 2-3 sentences of supporting context
  • CTA encouraging saves (highest-value signal on Instagram)
  • 8-10 hashtags (mix of high-volume and niche)

WhatsApp/community (50-70 words):

  • Conversational, as if sharing with a colleague
  • Key insight in one sentence + one discussion-starting question

Pinterest (100-150 words):

  • Keyword-rich, search-intent focused
  • Describes infographic contents specifically (Pinterest is a search engine — descriptions matter)

Platform-specific variations are not stylistic choices — they reflect fundamentally different consumption behaviours. LinkedIn rewards professional depth. Instagram rewards visual surprise and saves. WhatsApp rewards practical utility. Pinterest rewards searchability. Writing the same copy for all four platforms is the most common infographic distribution mistake.

Prompt 5: build an infographic series plan

One infographic is a content moment. A series is a content strategy — and AI makes planning one from a single successful piece straightforward:

Infographic topic: [topic]

Audience: [description] Plan an 8-week infographic series building on this topic.

For each infographic:

  • A different angle (series teaches progressively, not repetitively)
  • Specific insight or revelation
  • Format type (vary from previous for visual variety)
  • Connection to previous infographic (what makes this more valuable knowing the last one?)
  • Series hook: one short phrase positioning this as part of the ongoing series

Also:

  • A series name that works as a consistent visual badge on each piece
  • How the series could be repurposed: carousel / PDF download / blog post / email newsletter
Student learning React Native mobile app development with AI, Expo, APIs, and practical projects at Learn2Earn Labs.

AI Integrated React Native Mobile App Development Training

Build a job-ready mobile app development profile through practical coding, industry-style projects, AI-assisted workflows, career preparation, mentor-guided learning, real-world app deployment, API integration, and hands-on portfolio development.

How Learn2Earn Labs trains digital marketers to create visual content that travels

At Learn2Earn Labs, visual content creation — infographic strategy, social media content planning, AI-assisted design workflows — is woven throughout the Digital Marketing program, not siloed into a single module.

Students practise the full five-prompt workflow described in this blog using real topics for actual brands and audiences. Infographics built during the program are reviewed for insight density, information hierarchy, and platform-specific distribution strategy — not just whether the Canva design looks professional.

The emphasis is on content that earns its reach. A marketer who consistently creates infographics that people share — because the information is surprising, the structure is clear, and the distribution is platform-native — builds the kind of content track record that clients and employers notice.

Career counselling prepares students to build a portfolio that includes visual content samples alongside strategy documentation — because showing an employer an infographic you created, plus the prompt workflow and distribution strategy behind it, demonstrates professional content thinking that most candidates cannot match with certificate credentials alone.

With alumni placed at TCS, Accenture, Cognizant, Infosys, and Nagarro, and with decades of experience shaping digital marketing and content careers across India, Learn2Earn Labs trains every student to produce output that is both technically competent and genuinely effective at reaching an audience.

Visit learntoearnlabs.com or write to team@learntoearnlabs.com

Conclusion

Infographics that get shared are produced by better content thinking — specific angles, surprising data, clear visual hierarchy, distribution copy calibrated to platform behaviour.

AI handles the content thinking. Canva handles the execution. The marketer’s job is to direct the process: know what question to ask, evaluate what comes back, and make the judgment calls that turn a good structure into something genuinely shareable.

The five prompts here cover every stage from concept to distribution. Use them in sequence, refine where your knowledge of the audience is sharper than the AI’s, and build the series.

One shareable infographic builds credibility. A series builds authority.

Frequently Asked Questions

These questions are designed around the article’s content and related informational search queries. Each answer is concise enough to be understandable independently while offering practical guidance.

1. How can I create infographics using ChatGPT and Canva?

You can create infographics using ChatGPT and Canva by following five steps: generate infographic content ideas, organize the information into a clear structure, prepare a visual design brief, design the infographic in Canva, and write platform-specific captions. ChatGPT helps with ideas, content organization, and design instructions, while Canva provides templates and editing tools. Review factual claims and statistics before publishing.

2. What are the best ChatGPT prompts for infographic content ideas?

Effective ChatGPT infographic prompts specify the target audience, topic, publishing platform, desired format, and the information readers should learn. Ask ChatGPT to generate several concepts, identify the strongest insight for each, recommend suitable visual formats, and explain why audiences might share the content. Follow this with separate prompts for content structure, Canva design instructions, social captions, and series planning.

3. How do I make an infographic more shareable on social media?

To make an infographic more shareable, focus on useful insights, a clear information hierarchy, credible data, and an easy-to-follow visual structure. Use concise headings, readable typography, and a design suited to the target platform. Share the infographic with a caption that explains its practical value. Content that helps viewers understand or communicate something useful may encourage saves and shares, although results vary by audience and platform.

4. Can I create professional infographics without graphic design experience?

Yes. Beginners can create professional-looking infographics using Canva templates and AI-assisted planning. ChatGPT can help organize information, suggest layouts, recommend visual elements, and prepare a design brief. Canva allows users to customize colors, icons, typography, charts, and templates without advanced design skills. However, human review remains important for factual accuracy, accessibility, and visual clarity.

5. How can I use AI to plan an infographic content series?

You can use AI to plan an infographic series by providing ChatGPT with your main topic, audience, content goals, and publishing frequency. Ask it to generate an eight-week plan with a different subtopic, key insight, visual format, and distribution idea for each week. Organize the sequence so every infographic adds new information. Monitor audience engagement and use the results to improve future content.